It’s that time of year again when we analyze the lists of large companies in our region. This year we’re using Tableau ™ software to create visualizations of the data. The data come from The Business Journal’s Book of Lists 2013.
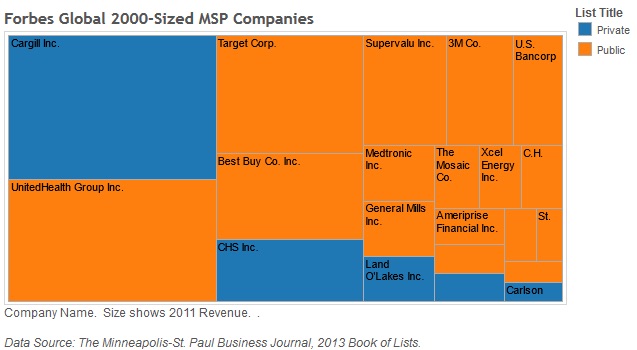
Greater MSP uses the Forbes Global 2000 ranking to list major employers. This list ranks companies with over US$ 4.4 B in revenues. The first visualization looks at companies with revenues above that level. Companies are shown as private (blue) or public (orange), and the size of their box represents their revenue. You’ll note that last year’s blog on this pointed out the significant private companies in the MSP region that are private, and therefore “invisible” to lists like the Fortune 500 which only rank private companies.
 Click here to open the interactive version in your browser. The tabs at the top of the screen move you between visualizations in this blog where you can mouse over companies and get their details.
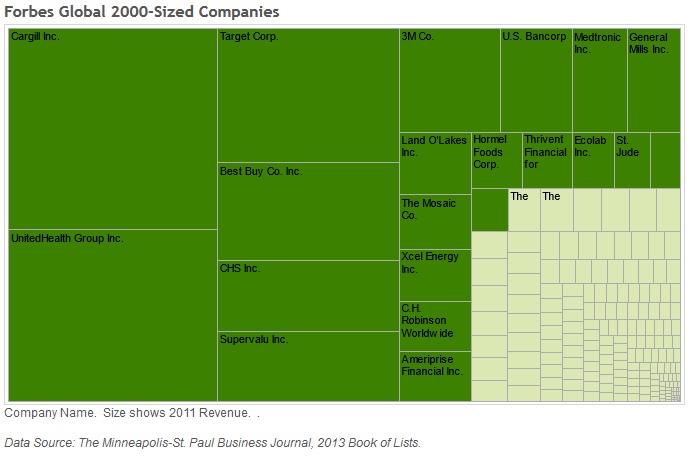
The next visualization shows how these larger companies (dark green indicates the companies of “Forbes Global-2000 size”) rank compared to rest of the companies on the lists of the largest 100 private and 100 public companies in MSP. Note that the diverse ranking of Forbes Global 2000-Sized companies account for about ¾ of the revenue in this market. Follow-up questions include: how does this rank compared to other MSAs (Metropolitan Statistical Areas) in terms of diversity, bench strength, recession-resilience, and other measures of economic strength?
 Click here to open the interactive version in your browser. The tabs at the top of the screen move you between visualizations in this blog where you can mouse over companies and get their details.
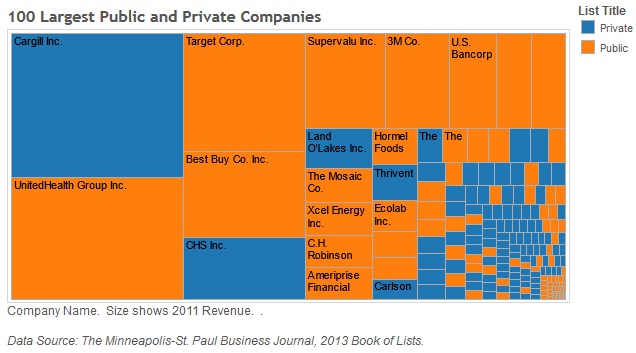
The final visualization shows the top 100 private and 100 public companies split again into private (blue) and public (orange). The important point here is to note the preponderance of private (blue) companies in the sub-Forbes Global-2000 zone in the lower right corner. This speaks to bench strength of entrepreneurial organizations, and the strength of the economy that constantly has mid-sized companies “waiting in the wings” to grow into larger companies.
 Click here to open the interactive version in your browser. The tabs at the top of the screen move you between visualizations in this blog where you can mouse over companies and get their details.
